Geospatial Grid Intelligence
The Map for
The Map for
Visualize the electrical system as a living organism. Identify flows, bottlenecks, and hidden opportunities.
Interactive Intelligence
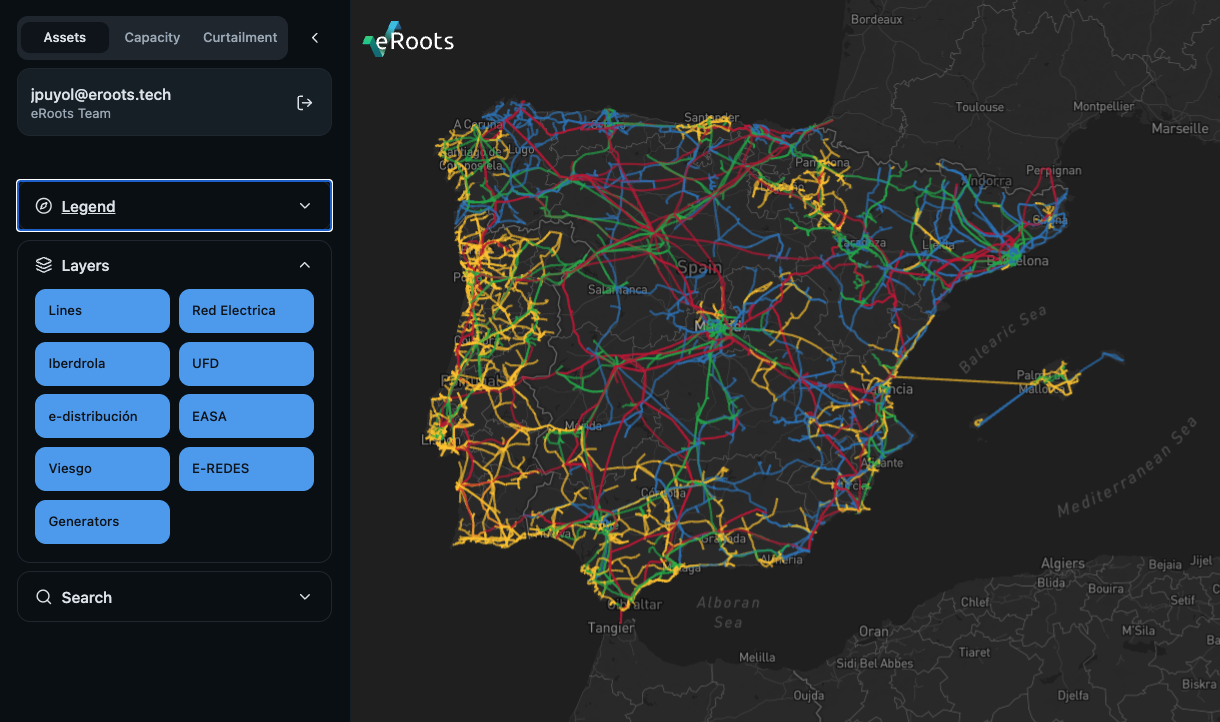
A Living Map of the Energy System
The eRoots electrical map is the first platform that allows visualizing the Iberian Peninsula's energy system as a living organism: with flows, bottlenecks, renewable curtailment, and hidden opportunities that no one could see before.
eRoots is not just another map. It is an energy geo-intelligence tool, designed to help:
-
Renewable Developers Find viable nodes and mitigate the risk of curtailment.
-
Large Consumers & Data Centers Locate zones with renewable surplus and low prices to sign PPAs.
-
Energy Consultancies Analyze scenarios, validate models and make decisions with real physical grid data.
“Until now, electrical data was locked in PDFs, tables, and opaque viewers. We turn them into a clear, visual platform connected to the country's energy future.”
— The eRoots Team
What makes the eRoots map unique
Shows what others don't:
-
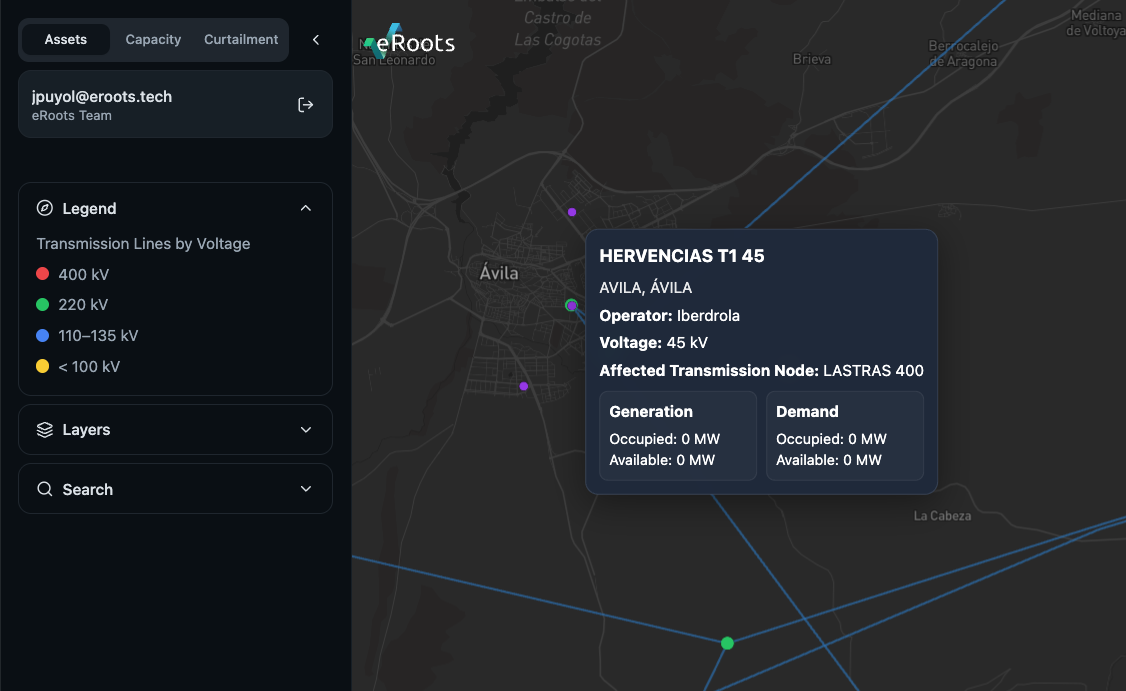
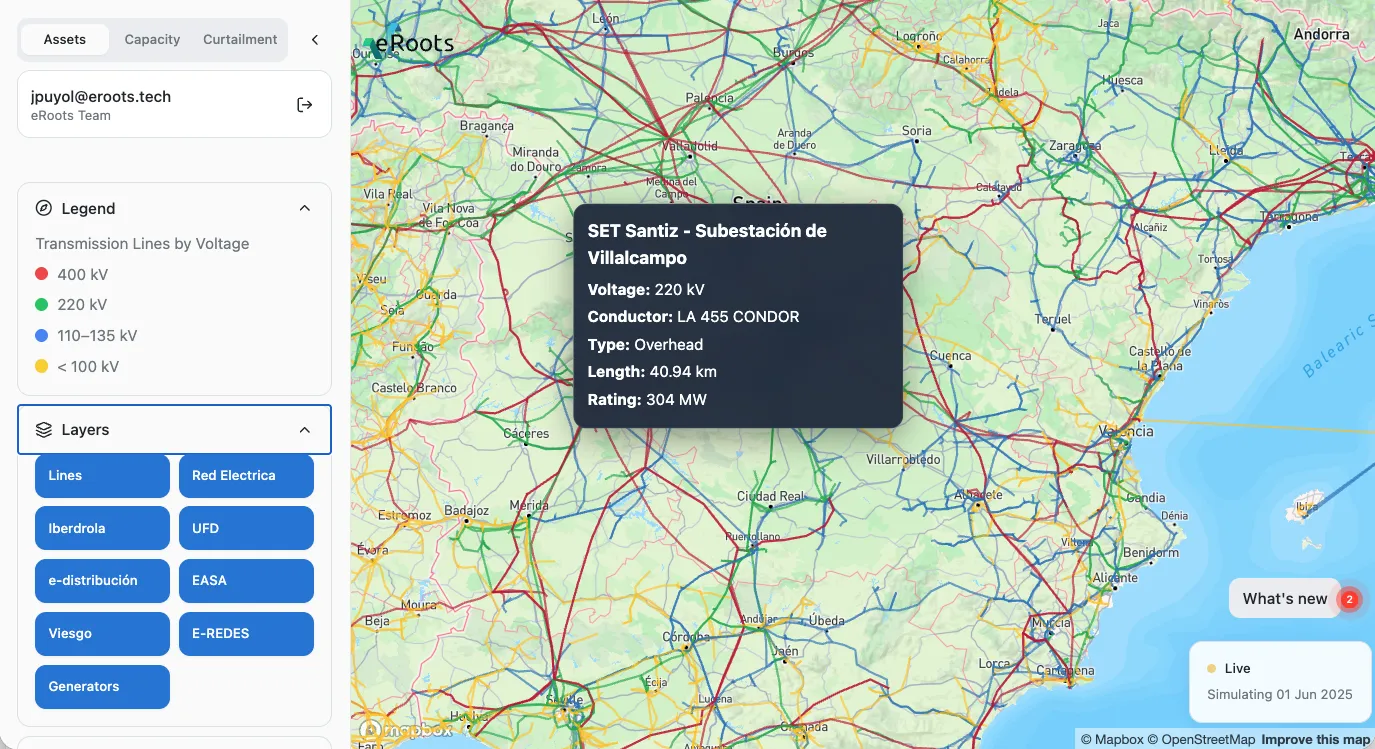
Complete Visualization Full visualization of the Spanish electrical system, with all nodes, assets present and future, energy flows and REE–OMIE data integrated.
-
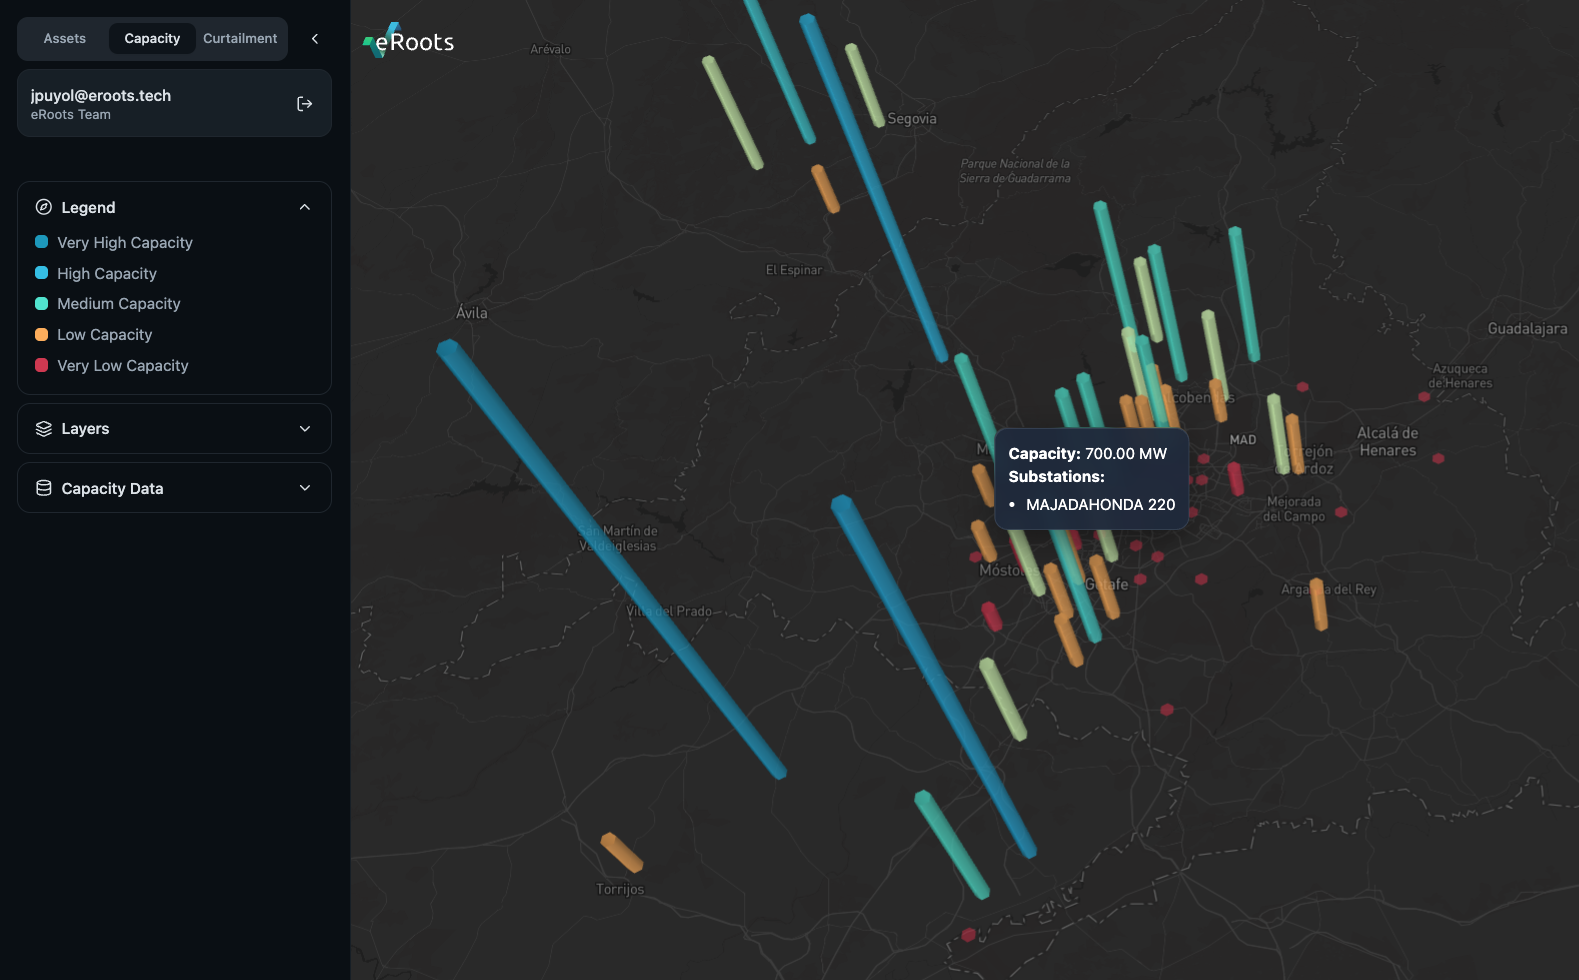
Designed for Real Decisions Includes scenario simulators, curtailment modeling, price forecasting, node capacity analysis and technical evaluation of locations.
-
Ready to Act From finding where there is cheap energy today, to deciding where to locate the next solar plant or data center.
Beta Access
Available today, for those who move first.
The beta is now active for a limited number of teams in key sectors: renewable development, industry, technology and energy consultancy. Beta users can test advanced functionalities and send feedback directly to the eRoots team.