VeraGrid Feature Spotlight: Power Flow
October 15, 2025
VeraGrid Feature Spotlight: Power Flow Analysis for Modern Grids
Welcome back to the VeraGrid Feature Spotlight series. In each installment, we explore one of the core capabilities of VeraGrid, our open-source platform built for modern power system analysis. This time, we turn our attention to a topic that underpins almost every grid study: power flow analysis.
Understanding how electricity moves through a network is the foundation of planning, operating, and expanding power systems. Whether you are designing new infrastructure, optimizing existing assets, or integrating new technologies like grid-forming converters, power flow provides the essential snapshot of how your network behaves under steady-state conditions.
Why power flow matters
At its core, power flow analysis answers fundamental questions about the state of the grid. It tells us what the voltage is at each node, how power is exchanged between different parts of the network, and where the system may be approaching its technical limits. With this information, engineers can verify that the network is operating securely, identify potential bottlenecks, and explore what changes might be needed to accommodate future growth or new operational strategies.
Because of its central role, power flow is often the first step in a wide range of studies. It informs contingency analysis, voltage stability assessments, optimal power flow calculations, and planning decisions at both the transmission and distribution level. It’s also the starting point for exploring the impacts of new technologies on the wider grid.
Using a visualizable benchmark grid
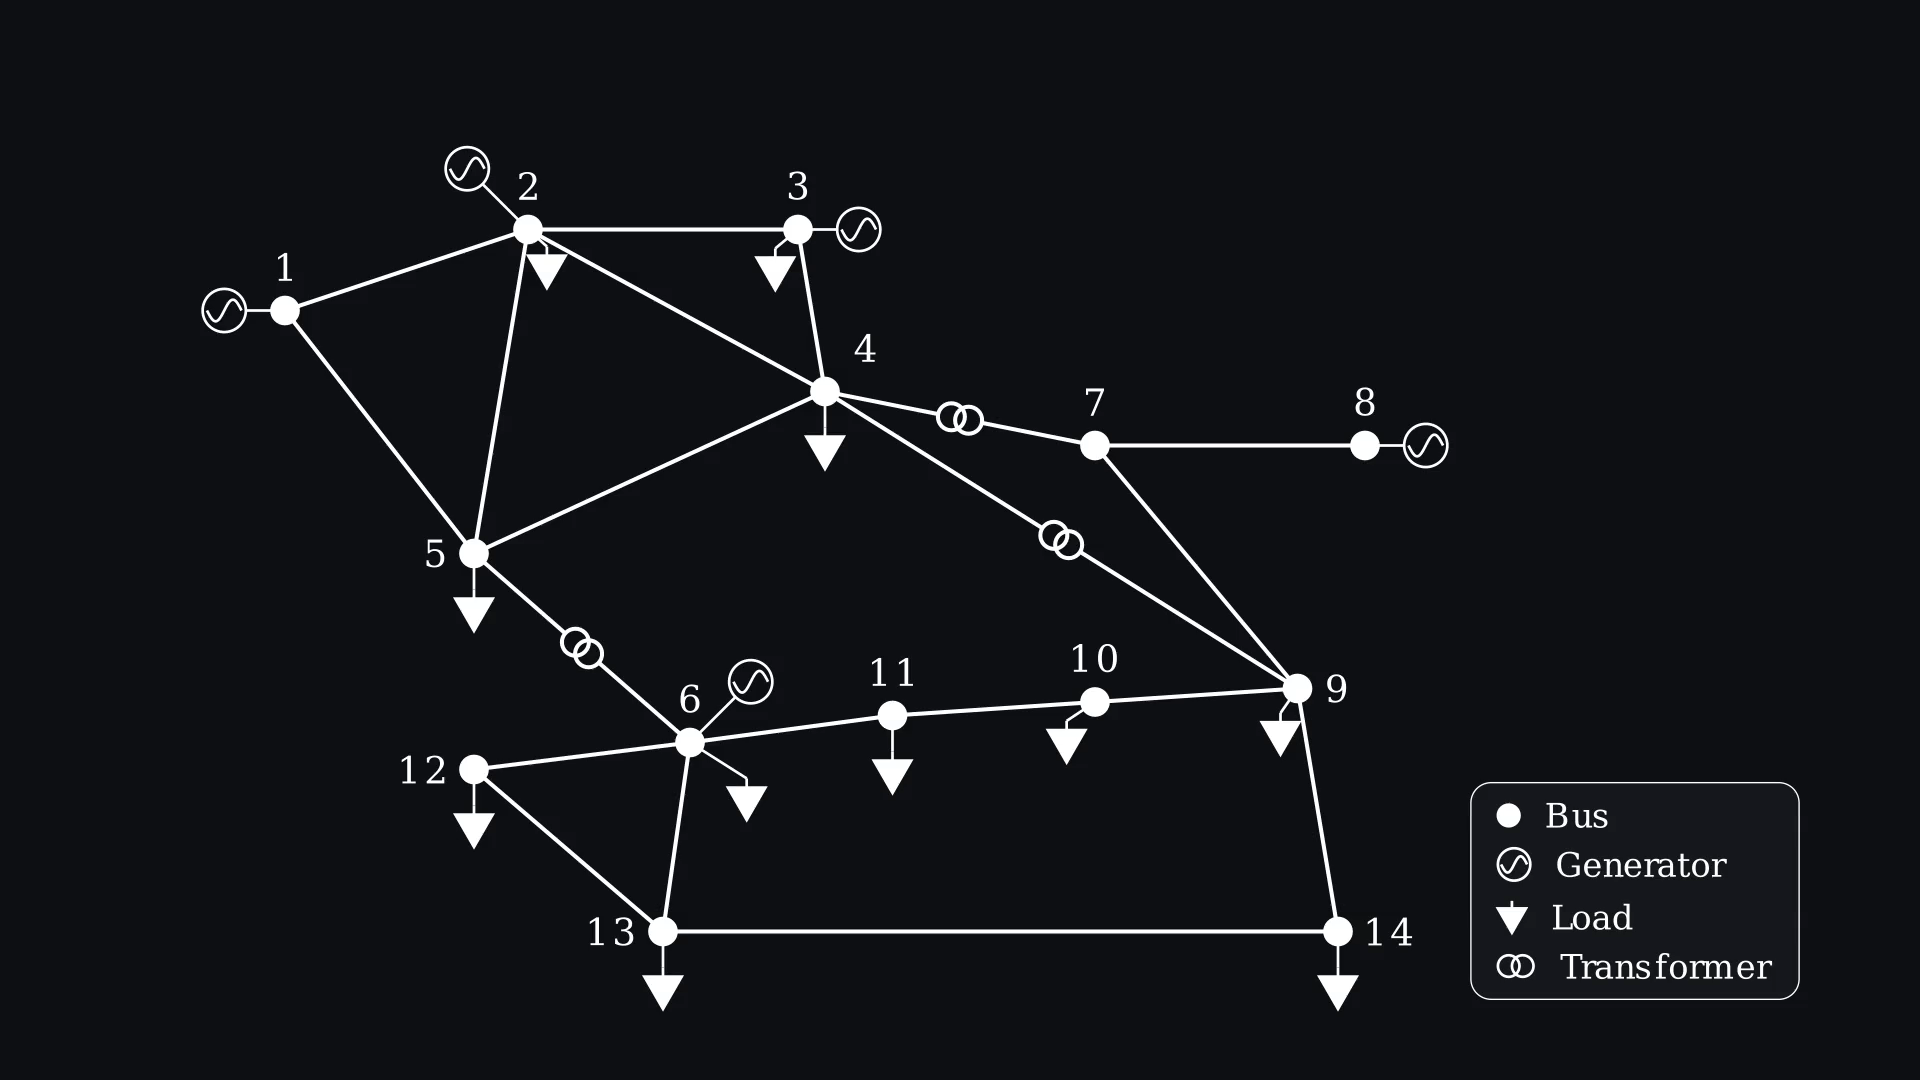
To illustrate power flow analysis in VeraGrid, we use the classic IEEE 14-bus network. It’s small enough to visualize clearly, yet complex enough to capture the essential dynamics of a real transmission system. Within this network, buses act as the connection points where power is generated, consumed, or transferred. Transmission lines and transformers define how these buses are linked together electrically, shaping the network’s structure. Generators inject power into the system, and loads represent the demand that must be met.
Once these elements are in place, solving the power flow reveals how power actually moves through the system. It provides a complete view of voltages, flows, and system conditions, which you can then use to check operating limits and explore how different parts of the network interact.
Evolving approaches, unified in one platform
The way engineers solve the power flow problem has evolved significantly over the decades. Early methods focused on speed and simplicity to support rapid planning studies, while newer approaches bring greater accuracy and robustness for today’s more complex networks. VeraGrid brings these different techniques together into a single platform, so users can move smoothly from quick approximations to detailed, high-fidelity analyses without changing tools.
Beyond the standard formulations, VeraGrid also extends power flow capabilities to capture real-world behaviors that are increasingly important in modern grids. It can account for the impact of transformer tap changers, enforce reactive power limits, model the behavior of converters in meshed AC/DC systems, and even handle unbalanced three-phase conditions. These capabilities allow engineers to study networks that look much more like the ones they’re actually building and operating today.

Flexible ways to build your model
Before solving the power flow, you need a network model. VeraGrid is designed to make that process flexible, so you can work the way that suits you best.
If you already have a network defined in another tool or exported in a standard format, you can import it directly into VeraGrid. The platform automatically checks the data and generates a detailed log, highlighting anything missing or inconsistent so you can quickly validate and debug your model.
If you prefer a more hands-on approach, you can build a network manually through the interface. Buses, lines, transformers, generators, and loads can all be added interactively, and parameters can be set directly on each element or through the integrated database panel.
For those who prefer scripting, the entire network can also be defined through code. This is ideal for automated workflows, parameter sweeps, or integrating power flow studies into larger toolchains.
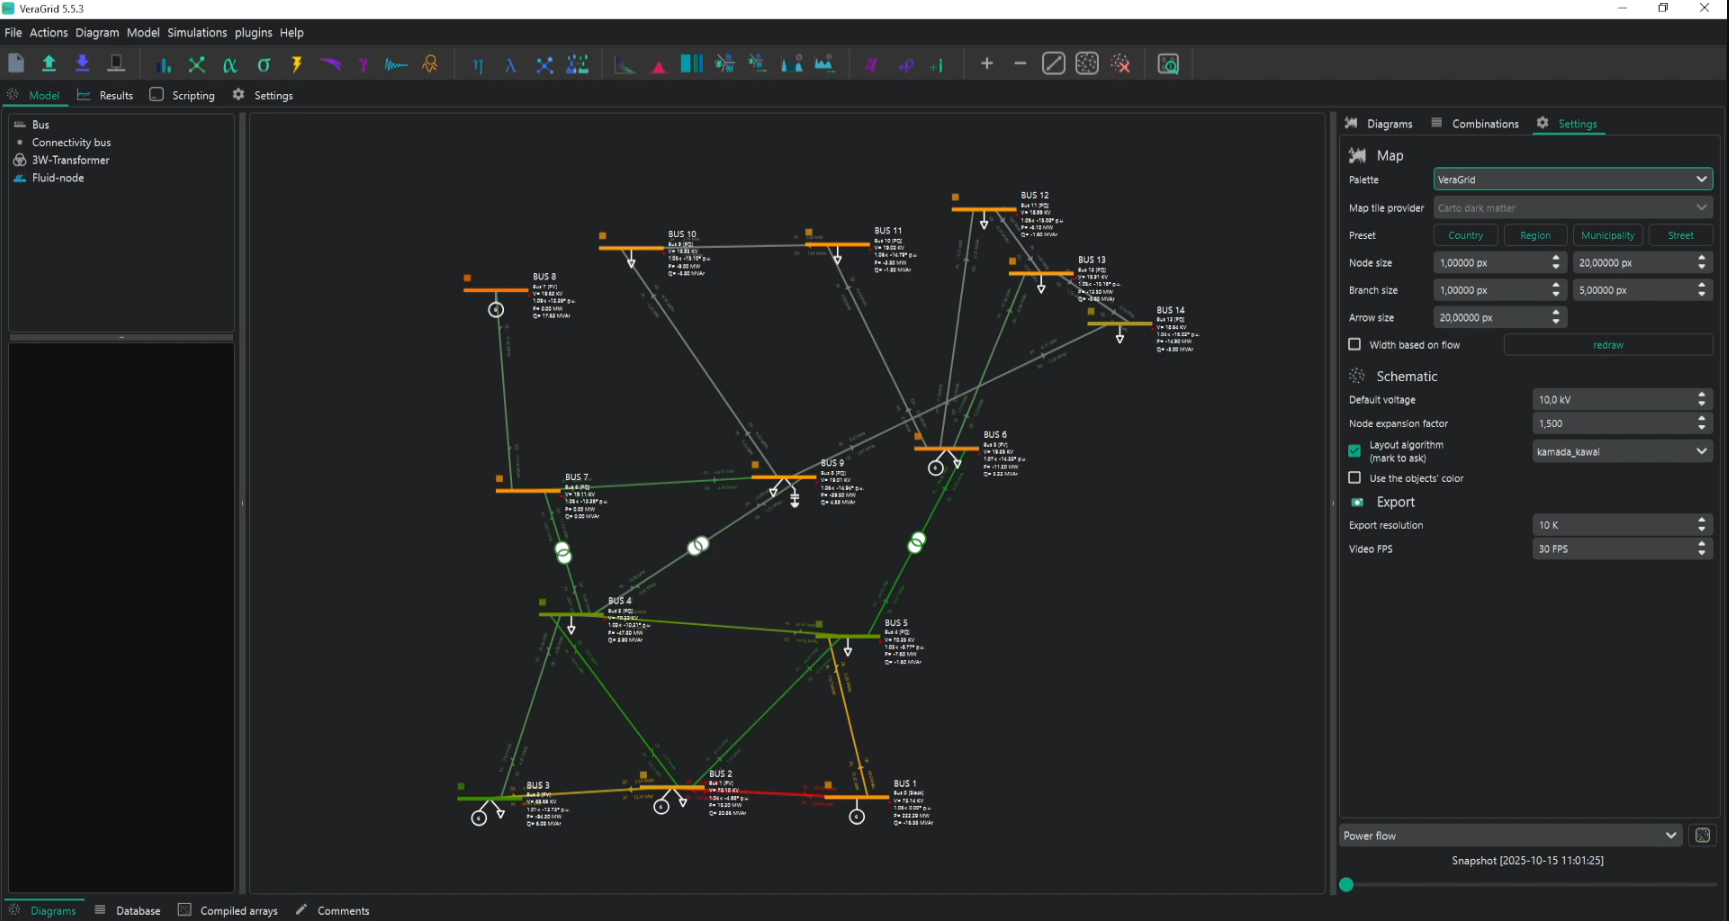
Whichever path you choose, VeraGrid includes automatic layout tools that organize your model into a clear, readable schematic, even if the elements were created without positions.
Powerful controls for solving the flow
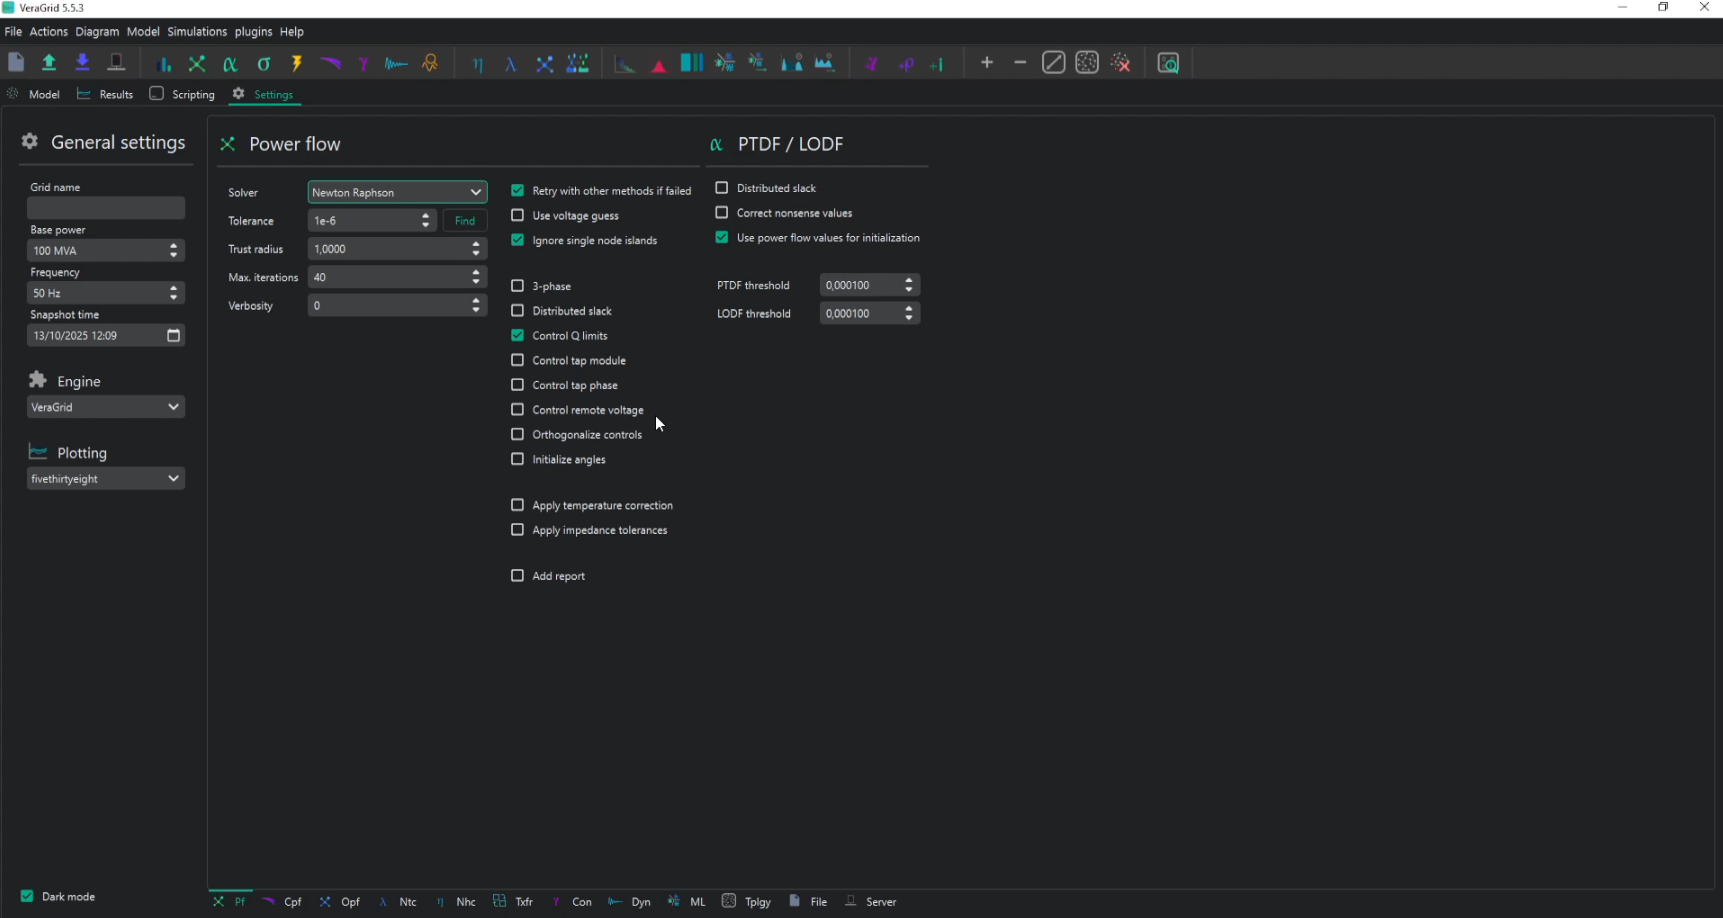
Once your network is ready, VeraGrid gives you full control over how the power flow is solved. You can set the convergence tolerance, limit the number of iterations, or define a “trust radius” that controls how far the solver moves in each step. Adjustable verbosity settings make it easy to see how the solution is progressing, invaluable when you’re trying to understand solver behavior or debug a challenging case.
For added reliability, VeraGrid can automatically fall back to alternative solvers if the first attempt struggles to converge. You can also provide your own initial voltage and angle values as a starting point, which often improves convergence speed and stability in large or complex networks. Options like ignoring isolated single-bus islands help keep the focus on the main network.
Advanced users can enable unbalanced three-phase calculations, distributed slack control, reactive power limits on generators, transformer tap-changer modeling, and remote voltage control. Each of these options helps align the solution more closely with the realities of physical networks and operational practices.
From results to insight
After solving the power flow, VeraGrid makes it easy to explore the results and extract insight. Voltage magnitudes and angles are available for every bus, while branch loadings reveal how power is distributed across the network. These results can be visualized directly in the interface or exported as CSV files for further analysis and reporting.

VeraGrid also produces a detailed log of the solution process. This includes timing, the number of iterations, and the final error value, along with a clear indication of whether the solution converged within your defined criteria. If reporting is enabled, the log will also flag issues such as overloaded lines, generators operating outside their limits, or bus voltages that fall outside acceptable ranges, giving you immediate feedback on where to focus next.
Resources
- Documentation: https://veragrid.readthedocs.io
- Source code: https://github.com/SanPen/VeraGrid
- Video: https://www.youtube.com/watch?v=d9dTyO4wels