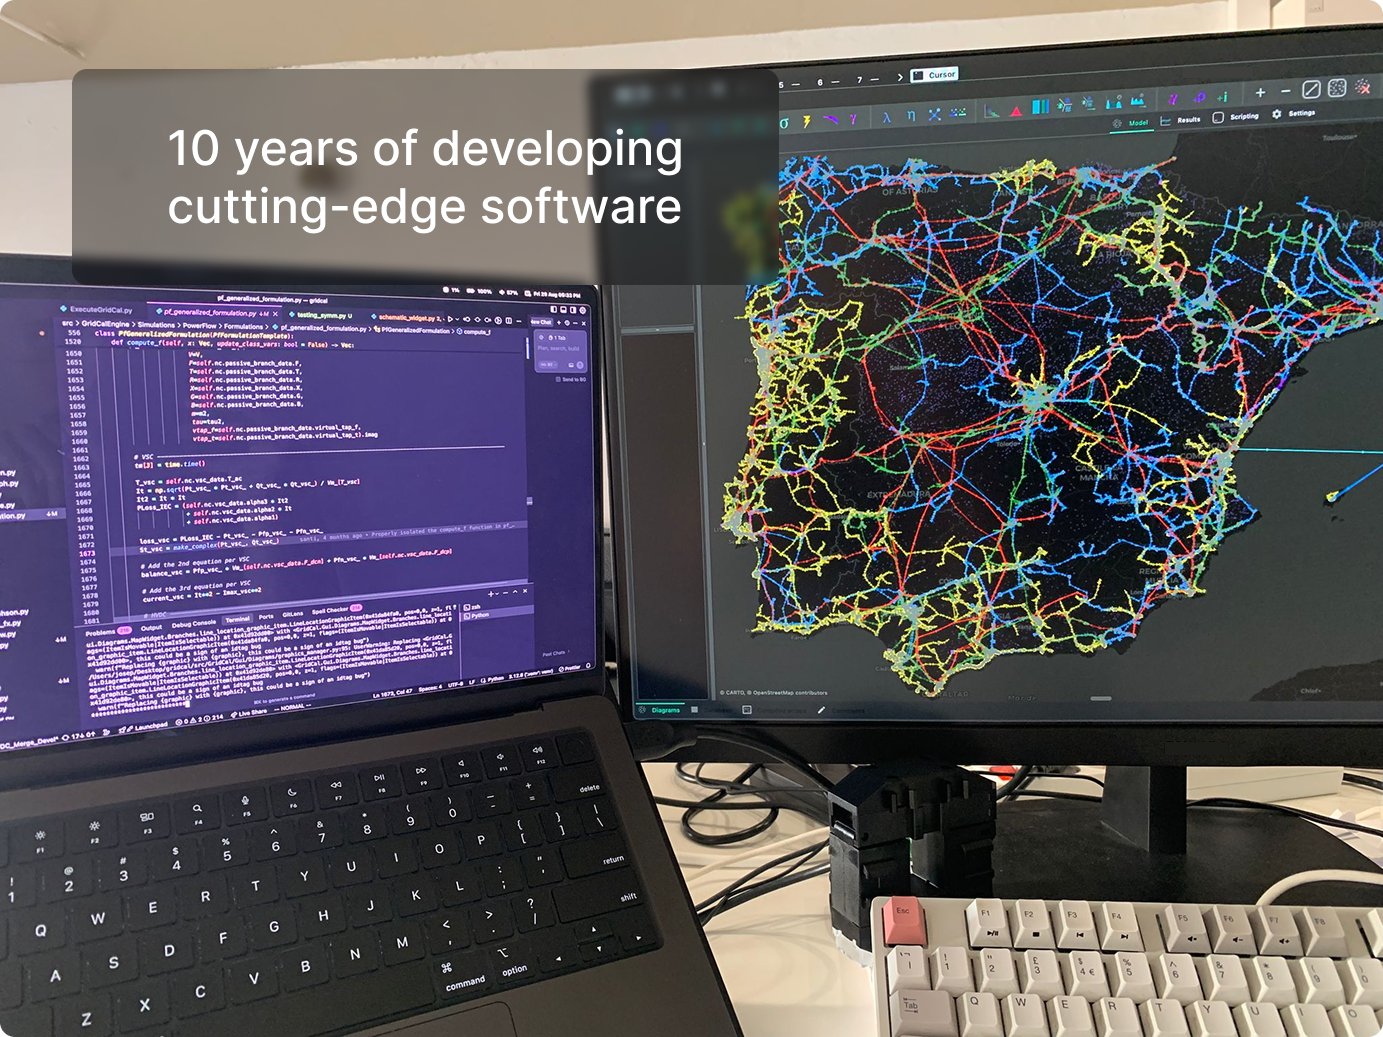
Our CTO Santiago Peñate publishes the first version of VeraGrid, a power systems software package written in Python with both powerful algorithms and visualization capabilities.
2022- eRoots constitution
eRoots is formed to solve some of the most pressing challenges in the power systems field, including short-circuits in modern grids. Software becomes the cornerstone vehicle to achieve that.
2025- Software expansion
Since its constitution, eRoots has been expanding its software capabilities, enriching the steady-state capabilities, while adding feature-rich dynamic and stability features
The Map
When national-wide models meet algorithms and visualization tools. Capture precise insights on how the grid operates.
Power grid's information is often obscure. We are here to change this narrative. eRoots couples rich grid data with powerful algorithms to optimize your decision making
Request early access
We are looking for partners interested in providing their feedback
"I used Veragrid within the Emerge project to model the electrical systems of Mozambique, Mali, and Morocco. The library was crucial for developing and validating these models and performing the necessary power flow calculations, which formed the fundamental basis for implementing advanced tools like Hosting Capacity and Optimal Storage Placement. I value the tool highly because it is open-source software, but what makes it particularly effective is its ease of use and seamless native integration with Python, which significantly streamlines the development workflow and data analysis."
Adrián Alarcón Becerra
CIRCE
"We performed a study where we compared differences between using a proprietary tool and VeraGrid for a similar purpose, and we showed how VeraGrid could provide the same technical performance in computational results, while at the same time being more adaptive to changing computing environments."
Luigi Vanfretti
Rensselaer Polytechnic Institute
"Having used VeraGrid for more than one year now, it's become a key component in my research on network operation. It is a complete and powerful tool, backed by an incredibly responsive and knowledgeable team."
Ferran Bohigas i Daranas
CITCEA-UPC
"VeraGrid has the potential to become one of the best tools for our current electric problems such as: distributed energy sources, industrial capacity batteries or current migration patterns that have affected demand in key areas of the grid"
Run robust power flow studies at scale. VeraGrid offers AC, DC, and hybrid formulations with advanced solvers that ensure fast and reliable convergence:
Whether you need steady-state results or stress testing of large systems, our algorithms provide dependable insights. Optimise operations and reduce bottlenecks with confidence.
Unlock smarter grid operations with VeraGrid’s Optimal Power Flow (OPF). Choose between AC, DC, and security-constrained formulations to balance technical feasibility with economic efficiency. Advanced solvers handle large-scale optimisation, integrating generator limits, line ratings, and market constraints with precision.
From day-ahead planning to real-time dispatch, OPF equips you with actionable insights to minimise costs, maximise reliability, and make the most of renewable integration.
Confidently explore trade-offs and drive better operational decisions at every level, backed by robust and scalable algorithms.
Strengthen system security with VeraGrid’s Short-Circuit Analysis. Our engine models both traditional synchronous sources and modern converter-based generation to deliver realistic results that reflect today’s evolving grids. Built on advanced formulations, it scales from distribution feeders to continental networks. Key capabilities include:
- Calculations for three-phase, line-to-line, and single-phase faults - Accurate treatment of converter-dominated systems - Dynamically matching for national-wide grids
With dependable fault analysis at your fingertips, you can assess vulnerabilities, validate protections, and design resilient networks that withstand critical events.
Gain transparency into system congestion with VeraGrid’s Power Transfer Distribution Factors (PTDF). PTDF analysis quantifies how injections and withdrawals at different nodes impact line flows, offering a clear view of grid sensitivities and bottlenecks. With PTDF you can:
- Evaluate the impact of transactions and redispatch on network loading - Identify critical branches and optimise cross-border exchanges - Support market coupling and flow-based capacity allocation with confidence
Whether for market studies or operational planning, PTDFs provide the scalability and computational ease you need to assess system limits and unlock more efficient grid utilisation.
Anticipate the impact of contingencies with VeraGrid’s Outage Transfer Distribution Factors (OTDF). OTDFs quantify how transactions or injections will redistribute after a line outage, giving you a fast and reliable tool for contingency screening and planning. With OTDF you can: - Predict post-contingency flows and spot potential overloads early - Enhance N-1 and N-k security studies with scalable, high-performance calculations - Support operational planning and market processes with accurate sensitivity insights
By embedding OTDF analysis into your workflow, VeraGrid helps ensure security, optimise transfers, and keep your grid resilient under stress.
Have you ever wanted to capture the variation in time of your grid? Now you can do that with VeraGrid’s Time-Series capabilities. Device properties, such as load, generation, or voltage setpoints, can be assigned time-varying profiles, reflecting realistic operating conditions and renewable variability.Key advantages include:
- Profiles for demand, generation, and line rating - Seamless integration with power flow and OPF, among others - Automated sequential execution to reflect chronological system evolution
With time-series analysis, you can move beyond static snapshots and explore how your grid behaves hour by hour, day by day to improve long-term planning.
Instead of relying on fixed assumptions, stochastic analysis incorporates variability in loads, renewable generation, and system parameters, giving you a probabilistic view of grid behaviour. With stochastic simulations you can:
- Quantify the impact of uncertainty on voltages, flows, and reserves - Evaluate risk of overloads or violations under multiple scenarios - Support robust planning decisions by exploring probability distributions rather than single outcomes
This approach helps you move from deterministic “best guesses” to confidence-driven planning, to make sure your network is resilient under a wide range of operating conditions.
Test grid resilience with VeraGrid’s Cascading Failure (Blackout) analysis. Starting from a triggering event, the tool re-solves power flows step by step, removing overloaded elements and revealing how failures can propagate into widespread outages.Key benefits:
- Simulate deterministic or stochastic cascades - Capture islanding and blackout progression - Generate clear reports of failed elements and criteria
This feature helps you identify weak points and design grids that withstand critical chain reactions, to improve reliability under stressed situations.
Assess hosting limits with VeraGrid’s Nodal Capacity analysis. This feature determines the maximum generation or demand that can be connected at each bus without violating any constraint (thermal, voltage limits, etc.). With nodal capacity you can:
- Quantify available hosting capacity for renewables and new loads - Identify critical nodes and bottlenecks in the network - Support planning studies with transparent, location-specific limits
By mapping how much capacity each node can safely absorb, VeraGrid helps you guide investments, accelerate grid connections, and make the most of existing infrastructure.
Plan smarter with VeraGrid’s Investment Optimisation. This feature tackles the inherently multi-objective nature of grid planning, balancing technical performance with financial efficiency. By using advanced genetic algorithms, VeraGrid explores a wide range of options and delivers a clear Pareto front of solutions, to show the trade-offs between cost, reliability, and capacity. With investment optimisation you can:
- Evaluate alternative configurations of lines, transformers, and reactive devices - Compare solutions not just on cost, but also on resilience and integration of renewables
Instead of a single “best” answer, VeraGrid provides a portfolio of optimal choices so that you can pick the right path for your grid’s future.
Turn complex data into clear insights with VeraGrid’s advanced visualisation tools. Create unlimited interactive maps layered over real terrain, or schematic diagrams that highlight the electrical structure of your network. Both views update seamlessly with simulation results, letting you explore flows, voltages, and constraints in real time.
With full flexibility, you can generate as many maps and schematics as your study requires, zooming from continent-wide perspectives down to individual substations. These interactive views make it easier to communicate findings, spot critical issues, and guide decisions across both technical and strategic levels.
Grab your free copy
Click below to get a fully operative VeraGrid executable
Veragrid is great but it may not cover all your needs. GSLV (acronym for Grid SoLVer) was built with this purpose in mind. You can think of it as Veragrid on steroids; a C++ native software package constructed on the image of Veragrid to solve your most demanding problems.
GSLV increases productivity and opens the door to processes that were not feasible until now using conventional solutions. Its open architecture encourages incremental developments by leveraging existing functions. GSLV is available for Windows, Linux and MacOS. Being available for *Nix systems enables the use of economic cloud architectures. Running ancient desktop software on virtual machines is a waste, and you know it.
Written in C++
Python module available
Seamless modelling in bus-branch and node-breaker modes
Time-series everywhere
Parallel execution
Hierarchical model management
Available server for collaborative modelling
Accelerated linear and non-linear AC/DC power flow
Linear and non-linear optimal power flow (soon)
Dynamic modelling framework with RMS and EMT solvers (soon)
Streamlined integration with VeraGrid
Contact us for a demo
Looking for a super performant VeraGrid extension? Look no more
.png)


.svg)
.svg)
.svg)
.svg)


.svg)

.svg)


